
Introduction to the Retina project part of Microsoft Open Source#
At KubeCon 2024 Paris I got informed about a new Observability tool for Kubernetes networking. The tool is based on eBPF, which many of you know, is one of my favorite technologies. Microsoft open sourced the tool as announced in this blog post. Unfortenately, many people aren’t aware of Microsoft their participation and large contributations to open source communities. So after arriving home I directly started my journey to evaluate the project and go through the actual setup and features.
When started my first reading (end of March 2024) of the documentation on Retina.sh and from the repository I found some inconsistency in the repository, reporting an issue [131] ( https://github.com/microsoft/retina/issues/131) to discuss my first finding. I learned that the team still was busy updating the documentation website. Nevertheless, I walked into several other issues, which are also reported, but wanted to finish my first introduction into Retina.
Setup Retina#
Setting up Retina is easy and has become far smoother, since my first try. First we had to run make files like make helm-install-with-operator, but at the moment writing we just can execute the setup from pre-compiled helm charts, which makes it easier to set up.
Before executing the actual Helm deployment, we have to choose the setup mode. This is important, since it defines what metrics and functionality you can expect.
There are currently four modes to setup and collect metrics.
- Basic
- Basic, but with capture support
- Advanced with capture support and using remote context
- Advanced with capture support and using local context
For simplicity I have chosen the ‘Basic with capture’ mode, which includes the Operator. Later I preferred using the ‘Advanced with capture support and using local context’ mode. That’s the one we will walk through in the setup example.
For reference you can always have a look at the Setup documentation.
For the installation I’ve chosen to use a Dev/Test AKS 1.28.9 setup with Azure Linux. Also at the moment of writing, the latest version of Retina was pinned to 0.0.11.
VERSION=$( curl -sL https://api.github.com/repos/microsoft/retina/releases/latest | jq -r .name)
helm upgrade --install retina oci://ghcr.io/microsoft/retina/charts/retina \
    --version $VERSION \
    --namespace kube-system \
    --set image.tag=$VERSION \
    --set operator.tag=$VERSION \
    --set image.pullPolicy=Always \
    --set logLevel=info \
    --set os.windows=true \
    --set operator.enabled=true \
    --set operator.enableRetinaEndpoint=true \
    --skip-crds \
    --set enabledPlugin_linux="\[dropreason\,packetforward\,linuxutil\,dns\,packetparser\]" \
    --set enablePodLevel=true \
    --set enableAnnotations=true
After running the command you will see the following output, when the Chart is successfully deployed.
Release "retina" does not exist. Installing it now.
NAME: retina
LAST DEPLOYED: Sun Mar 24 10:08:18 2024
NAMESPACE: kube-system
STATUS: deployed
REVISION: 1
NOTES:
1. Installing retina service using helm: helm install retina ./deploy/manifests/controller/helm/retina/ --namespace kube-system --dependency-update
2. Cleaning up/uninstalling/deleting retina and dependencies related:
  helm uninstall retina -n kube-system
We can now validate if all expected Operators are available.
kubectl get crds | grep retina

captures.retina.sh                                    2024-03-23T20:15:09Z
metricsconfigurations.retina.sh                       2024-03-23T20:15:09Z
retinaendpoints.retina.sh                             2024-03-23T20:15:09Z
tracesconfigurations.retina.sh                        2024-03-23T20:15:09Z
I noticed that tracesconfigurations.retina.sh is not available anymore, since version 0.0.11, compared to version 0.0.2.
Last thing to validate if the retina-operator is running as expected.
kubectl get deploy  -n kube-system | grep retina

retina-operator      1/1     1            1           30s
Great, we are now ready to set up the next part, which are Prometheus and Grafana.
Observability with Kubernetes Prometheus stack initial setup#
For sake purpose and as documented, I will use the official open source KubeProm Stack, which is mentioned in the documentation as unmanaged Prometheus. Read more about the Prometheus-unmanaged setup here.
First thing to do is to add the chart repository.
helm repo add prometheus-community https://prometheus-community.github.io/helm-charts
helm repo update
Now as mentioned in the documentation, ensure you have created a values.yaml that contains the specific configuration below, which includes node configuration and Retina scraping rules.
curl -o kube-prom-stack-values.yaml https://raw.githubusercontent.com/microsoft/retina/main/deploy/prometheus/values.yaml
Let’s start the deployment.
helm install prometheus -n kube-system -f kube-prom-stack-values.yaml prometheus-community/kube-prometheus-stack

NAME: prometheus
LAST DEPLOYED: Sat Mar 23 20:30:53 2024
NAMESPACE: kube-system
STATUS: deployed
REVISION: 1
NOTES:
kube-prometheus-stack has been installed. Check its status by running:
  kubectl --namespace kube-system get pods -l "release=prometheus"

Visit https://github.com/prometheus-operator/kube-prometheus for instructions on how to create & configure Alertmanager and Prometheus instances using the Operator.
Import Grafana dashboards#
We have installed the unmanaged Prometheus stack successfully, but we still have to configure Grafana, especially by importing the Dashboard objects. We are now at this part of the documentation.
When following the documentation I could successfully import only one, which is ‘Kubernetes / Networking / Clusters’ of the three available dashboards, which is a known issue.
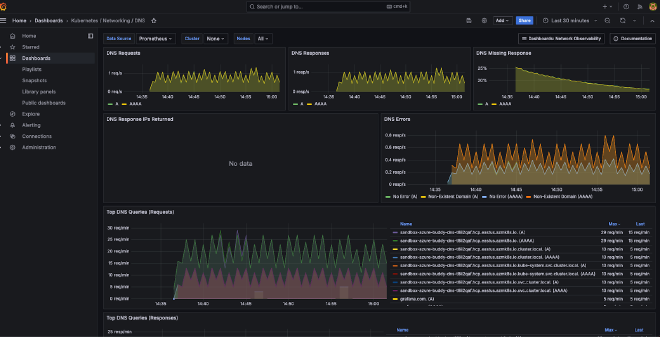
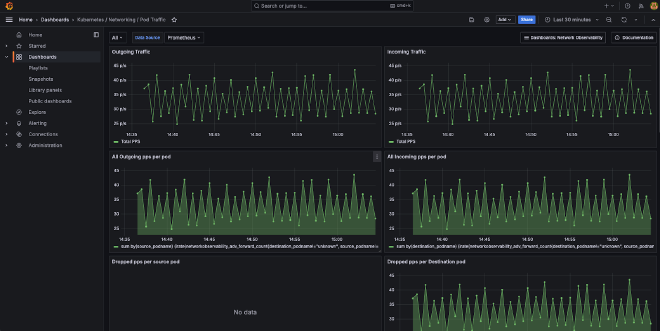
The other two dashboards are named ‘Kubernetes / Networking / DNS’, ‘Kubernetes / Networking / Pod Level’ and would be available under the ‘k8s:network-observability’ tag.
Let’s first start with the import as documented. First start a connection to your Grafana instance. You may have to open access to the Grafana service by using ‘kubectl port-forward’ or changing the service type to LoadBalancer.
For sake of demo purposes we will change the service type and update the actual exposed port to ‘8082’.
kubectl edit svc/prometheus-grafana -n kube-system
# change ClusterIP to LoadBalancer / change http-web port from 80 to 8082 and save the svc object again.
Now run the command below and write down the external ip address.
kubectl get svc/prometheus-grafana -n kube-system

NAME                 TYPE           CLUSTER-IP    EXTERNAL-IP      PORT(S)          AGE
prometheus-grafana   LoadBalancer   10.0.149.53   172.171.158.92   8082:32242/TCP   14m
Now open a browser session to the external ip, don’t forget to use the :8082 port. Login to Grafana with the default username ‘admin’ and password ‘prom-operator’.
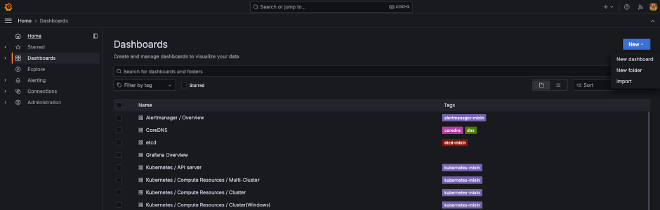
Now open the Dashboards section and click New>Import.
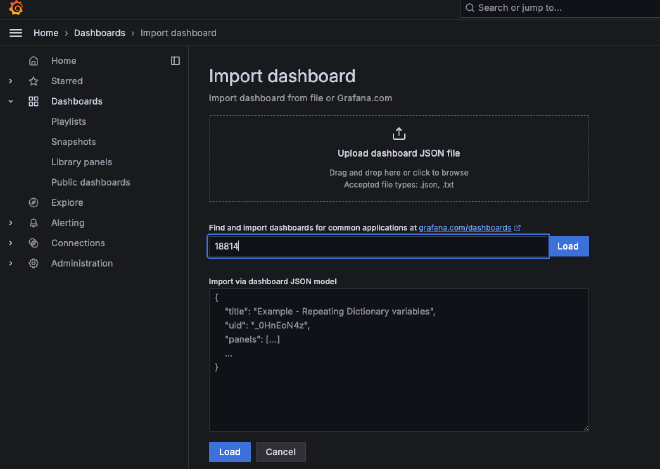
Now fill-in the dashboard ID 18814 and click Load. Et voila, click Import below.
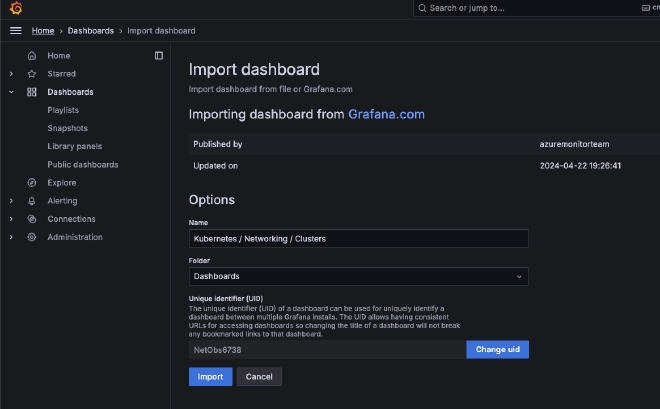
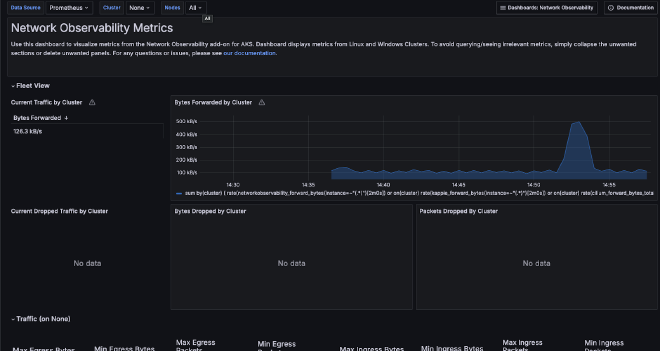
And we got one working dashboard called ‘Kubernetes / Networking / Clusters’.
Now let’s import the other two dashboards, since we can’t find them under dashboards.
To import these repeat the procedure opening the dashboard import page and paste the JSON (instead of an ID) I provide below. With some troubleshooting I found out that the PromQL metric names were incorrect, next to some Grafana specific variables for datasources.
First the DNS dashboard.
See my Github Gist, DNS json
Second Pod Traffic, see https://github.com/avwsolutions/retina/blob/fixes-avws/deploy/grafana/dashboards/pod-level.json
See my Github Gist, Pod-level json
Deploying a sample web application workload#
To create some real-live workload I’m going to deploy a sample web application workload. For this I chose to use the Otel chart packaged deployment, which is a fork of the famous GCP Microservices demo. It contains various components, including load generators.
Let’s start, since we have to customize our values file.
First add the repo again and run an update.
helm repo add open-telemetry https://open-telemetry.github.io/opentelemetry-helm-charts
helm repo update
Now generate the latest expected values file, which we are going to customize later.
helm show values open-telemetry/opentelemetry-demo > otel-demo-values.yaml
Go edit the otel-demo-values.yaml and set the following services disabled.
Tools | Updated value | opentelemetry-collector | enabled: false jaeger | enabled: false | prometheus | enabled: false | grafana | enabled: false | opensearch | enabled: false |
Now that you have disabled all tools above in the otel-demo-values.yaml, deploy the demo application.
helm install -f otel-values.yaml my-otel-demo open-telemetry/opentelemetry-demo
During the deployment keep an eye on the DNS dashboard and maybe you already guess what we still have to configure, before metrics here are monitored.
As learned from the documentation on other metrics outside kube-system we still have to annotate our namespace, which is default.
kubectl annotate ns default retina.sh=observe
namespace/default annotated
Now verify if the annotation is set correctly.
kubectl describe ns default
Name:         default
Labels:       kubernetes.io/metadata.name=default
Annotations:  retina.sh: observe
Status:       Active
If you want to open the demo frontend, you also have to update the service again.
kubectl edit svc/my-otel-demo-frontend
#change type: ClusterIP to LoadBalancer and save the svc object again.
Now open the demo frontend in another browser tab, let’s go shopping and you will see more DNS traffic being logged.
My current analysis is that the Pod Traffic dashboard isn’t yet as I would expect it. Still some work to do I guess.
Setup the Retina CLI#
Setting up the Retina CLI was my first issue that I’ve created, since the build script was missing. Nowadays you can easily download a client for your favorite OS. They also updated the second optio(2), which I created an issue for. You can read more at Retina.sh
Below the example, installing the CLI on Linux.
curl -LO https://github.com/microsoft/retina/releases/download/v0.0.11/kubectl-retina-linux-amd64-v0.0.11.tar.gz
tar -xvf kubectl-retina-linux-amd64-v0.0.11.tar.gz
install kubectl-retina-linux-amd64 kubectl-retina
Now try the following commands.
First lookup the version.
./kubectl-retina version
To see the option, run.
./kubectl-retina –help
Now dive into running captures using the CLI. Also here I found some issues with the Captures documentation. For example, every sample requires you to include ‘–name
./kubectl-retina capture create --name example --host-path /mnt/capture --node-selectors "kubernetes.io/os=linux" --no-wait=true
See the logging below.
ts=2024-05-25T13:43:06.488Z level=info caller=capture/create.go:243 msg="The capture duration is set to 1m0s"
ts=2024-05-25T13:43:06.488Z level=info caller=capture/create.go:289 msg="The capture file max size is set to 100MB"
ts=2024-05-25T13:43:06.488Z level=info caller=utils/capture_image.go:56 msg="Using capture workload image ghcr.io/microsoft/retina/retina-agent:v0.0.11 with version determined by CLI version"
ts=2024-05-25T13:43:06.489Z level=info caller=capture/crd_to_job.go:201 msg="HostPath is not empty" HostPath=/mnt/capture
ts=2024-05-25T13:43:07.051Z level=info caller=capture/crd_to_job.go:876 msg="The Parsed tcpdump filter is \"\""
ts=2024-05-25T13:43:07.149Z level=info caller=capture/create.go:369 msg="Packet capture job is created" namespace=default capture job=example-dd5hc
ts=2024-05-25T13:43:07.149Z level=info caller=capture/create.go:125 msg="Please manually delete all capture jobs"
If you want to see the actual status of the Job you can use the following two CLI commands.
First you can run the command below to get the capture job status.
kubectl get job

NAME            COMPLETIONS   DURATION   AGE
example-dd5hc   1/1           83s        91s
or using capture list.
./kubectl-retina capture list -A --name tes

NAMESPACE   CAPTURE NAME   JOBS                          COMPLETIONS   AGE
default     example        example-jhkmt,example-tg556   2/2           5m15s
Let’s look if the capture package is available for us. For this we will use the ‘kubectl debug’ command and executing a ls
kubectl debug node/aks-agentpool-34554001-vmss000000 -it --image=mcr.microsoft.com/cbl-mariner/busybox:2.0 -- ls -latr /host/mnt/capture

Creating debugging pod node-debugger-aks-agentpool-34554001-vmss000000-lnmlz with container debugger on node aks-agentpool-34554001-vmss000000.
total 3868
drwxr-xr-x    4 root     root          4096 May 25 13:43 ..
-rw-r--r--    1 root     root       3952184 May 25 13:44 example-aks-agentpool-34554001-vmss000000-20240525014309UTC.tar.gz
drwxr-xr-x    2 root     root          4096 May 25 13:44 .
Now let’s download this capture package. for this we are creating a Debug container and keep it running in the background.
kubectl debug node/aks-agentpool-34554001-vmss000000 -i --image=mcr.microsoft.com/cbl-mariner/busybox:2.0 &
Now write down the most recent Debug container that is created.
kubectl get pods | grep 'node-debugger`
# The name will include also your node name.
Create a local folder to store the capture packages locally and copy the capture package from the node to your local folder.
mkdir ~/localcaptures/example
kubectl cp node-debugger-aks-agentpool-34554001-vmss000000-ns2m2:/host/mnt/capture/example-aks-agentpool-34554001-vmss000000-20240525014309UTC.tar.gz ~/localcaptures/example/example-aks-agentp
ool-34554001-vmss000000-20240525014309UTC.tar.gz
Let’s extract the capture package.
cd ~/localcaptures/example
tar -xvzf example-aks-agentpool-34554001-vmss000000-20240525014309UTC.tar.gz
Let’s see that in the capture package.
~/localcaptures/example ]$ ls
example-aks-agentpool-34554001-vmss000000-20240525014309UTC.pcap    ip-resources.txt    proc-net      socket-stats.txt
example-aks-agentpool-34554001-vmss000000-20240525014309UTC.tar.gz  iptables-rules.txt  proc-sys-net  tcpdump.log
What do we have here to troubleshoot?
- Tcpdump PCAP file
- Socket stats
- IP resources
- IPTables rules
- Full dump of both network and sys.network process memory to files like arp, route, snmp, tcp, udp, etc.
Capture to object storage#
Unfortunately I couldn’t store my captures to Azure blob storage. Due to some unknown reason the SAS key is not well parsed. Also for this I’ve created an open issue 132.
Example capture, including upload example below.
./kubectl-retina capture create --name example --node-selectors "kubernetes.io/os=linux" --blob-upload https://azurebuddy.blob.core.windows.net/captures?sp=rw&st=2024-05-28T19:46:42Z&se=2024-05-29T03:46:42Z&skoid=5df443ed-258d-4282-960c-a8738d09d4ac&sktid=84f1e4ea-8554-43e1-8709-f0b8589ea118&skt=2024-05-28T19:46:42Z&ske=2024-05-29T03:46:42Z&sks=b&skv=2022-11-02&spr=https&sv=2022-11-02&sr=c&sig=43KBmVPx2mdVr6MNel0j3j51DGOLfQQQxxxF5oK3US4%3D
Create captures using Operator#
Another great feature to mention is creating captures using the operator. Below another example.
First you need to create an Kubernetes Secret.
cat <<EOF | kubectl create -f -
apiVersion: v1
data:
  ## Data key is required to be "blob-upload-url"
  blob-upload-url: aVW0cHM6Ly9sYWJjYXB0dXJlcy5ibG9iLmNvcmUud2luZG93cy5uZXQvcmV0aW5hP3NwPXImc3Q9MjAyNC0wNS0xOVQxMjo1Nzo1OVomc2U9MjAyNC0wNS0xOVQyMDo1Nzo1OVomc3ByPWh0dHBzJnN2PTIwMjItMTEtMDImc3I9YyZzaWc9eGViSzQ1NldLOWZZNWdaV1U5d3MVP0FqTWczbHFJZThlam5ISThkSG81ZyUzRAo=
kind: Secret
metadata:
  name: blob-sas-url
  namespace: default
type: Opaque
EOF
After the ‘Secret object’ is created successfully, you can create the actual ‘Capture object’.
cat <<EOF | kubectl create -f -
apiVersion: retina.sh/v1alpha1
kind: Capture
metadata:
  name: capture-example
spec:
  captureConfiguration:
    captureOption:
      duration: 30s
    captureTarget:
      nodeSelector:
        matchLabels:
          kubernetes.io/hostname: aks-agentpool-12105742-vmss000000
  outputConfiguration:
    hostPath: "/tmp/retina"
    blobUpload: blob-sas-url
EOF